Protein biomarkers
These are the protein molecules whose expression is an indication of a disease, a forecast of a disease or outcome of a treatment option. The disease, in our case, is a solid tumor. For example, Ki67 is a cell proliferation (division) biomarker in tumor diagnosis. A high Ki67 number means cell divides very fast, which is a bad thing. If the patient undergoes a treatment, and the Ki67 number reduced, that might be an indication that the treatment is working, as the cell division slows. However, if the Ki67 number increased, that is for sure a bad thing, as the treatment is not able to slow the cell division down. So a physician will look at the Ki67 number, currently a percentage called Ki67 index to tell if the treatment is working or not.
About IHC - How biomarker is measured currently
Immunohistochemistry (IHC) is the prevailing method currently to assess the expression level of a biomarker for solid tumor.
This method has been used in clinical diagnosis since 1940s. It remains the most used method to analyze the expression level of a biomarker by a pathologist.
For anyone underwent a surgery, most likely he or she will receive a pathology report including a paragraph: IHC result: x factor: -, Y factor: + etc.
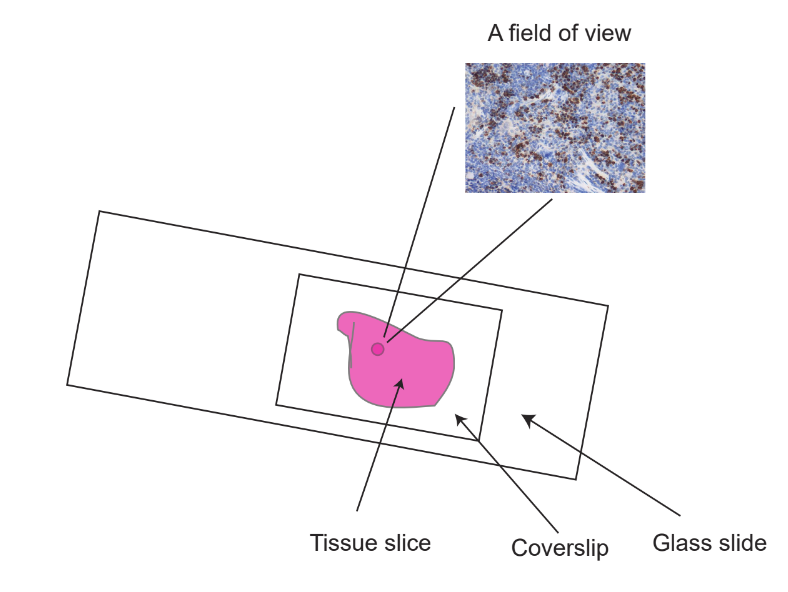
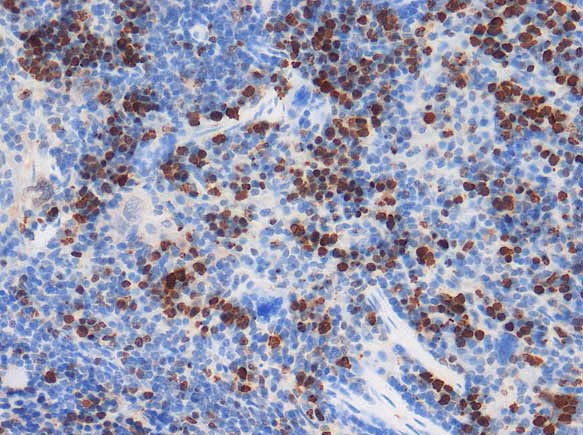
It follows antigen-antibody interaction. To put it simply, the tissue is processed into thin slice (about 0.005 mm), and is placed on a slide. This slice is then stained with an antibody (antibody -antigen interaction). The colored dots represent the expression level of a biomarker, and can be observed by a pathologist under a microscope.
The key features of IHC is: It is an image. The result is not a continuous number. Rather, it is categorized as + or -, or 0, +, ++, +++.
How reliable of a biomarker?
In most cases, they are all right. For someone specifically, no one would know.
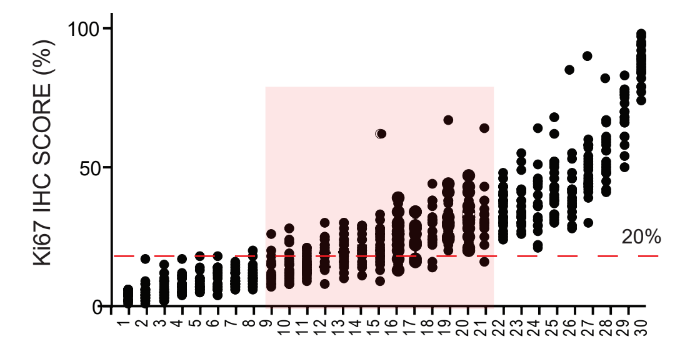
Here is a case again for Ki67. 30 different slides (x axis) were provided to 22 pathologist to quantify the Ki67 index. Each dot in this picture represent one Ki67 index from one slide by one pathologist. As an example, #21 slide was judged by 22 pathologists (See red square), and the lowest Ki67 was 16%, and highest was 66%.
What does this mean?
If a patient's ki67 index was 66% at the first time and after 6 months of treatment, this index changed to 16%. The physician most likely will tell the patient that the treatment is working, as cell division is slowed by the treatment. In most cases, he is right. But at least in our case, he is wrong. The cell division is the same.
A little something extra. We found out that the averaged Ki67 index from several pathologists (n>10) was quite accurate.
About QDB - Quantitative Dot Blot analysis
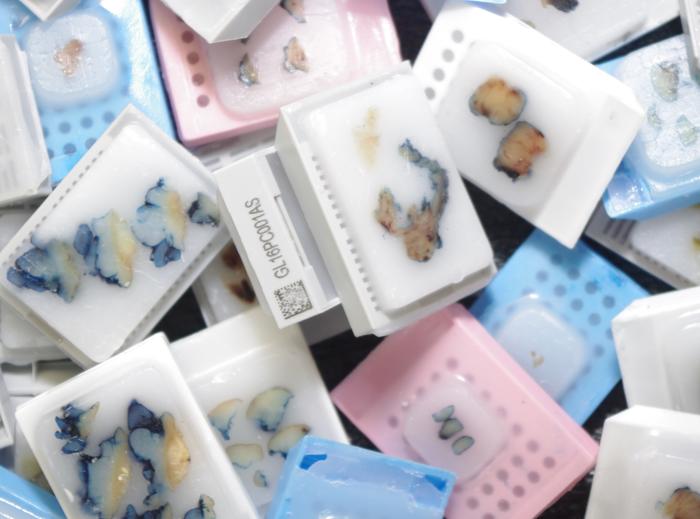
This is a high throughput format of Dot Blot analysis. This is a method to measure the absolute number of biomarkers in a block of tissues. However, it follows the same principle of antigen-antibody interaction with IHC. In fact, QDB and IHC use the same antibody for the same biomarker.
IHC shows the expression of a biomarker in the context of cellular morphology. The intensity of the staining, and the area of staining tells the Relative level of a biomarker. QDB cannot provide any morphological information. However, it is able to tell from a block of tissue, how many biomarker molecules existed in the block. The number of the molecules is decided by a machine, not by a person.